Registry Data-Dive: December 2020
The Companion Player Registry is the most-used feature of this site (so far). So in this data-dive I want to highlight some of the interesting data stored in it. Let's get started!
Available Players By Year (2013-2020)
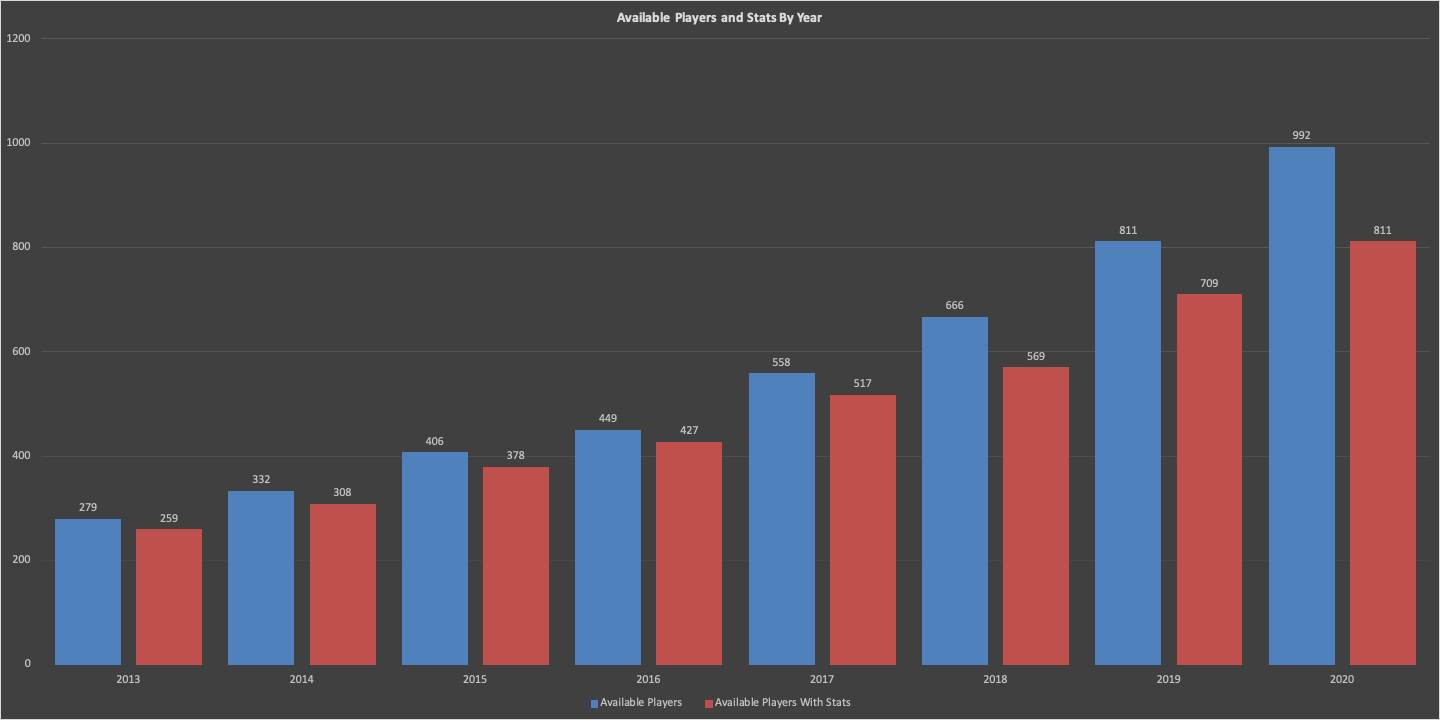
The Companion Registry includes a complete list of every player currently available in the game. Here's a graph of the total number of players from 2013-2020, as well as the number of players with stats in the registry:
The vast majority of cards sit in this range. These years contain the cards that you'll find in your typical packs, with players who are usually still active in MLB today.
We're doing pretty well. Every year has at least 80% stat coverage, and every year prior to 2018 has >90% stat coverage! Years not shown in this graph are at or near 100% stat completion. Years further in the past have a higher percentage of cards with stats in the registry. This is largely because there's been more time to find the stragglers, but also because over time, players drop out of the game so there are fewer stragglers to find.
Sources
While the list of available players comes from the in-game Chance page, there's
no way to extract the stat and position data from the game. So all of the data
you find in the registry has been meticulously currated by the community!
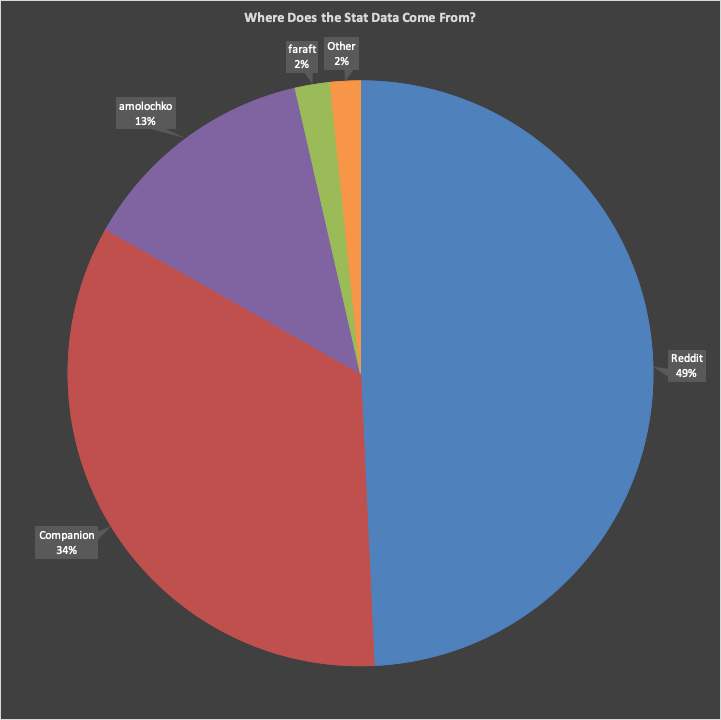
The Companion Registry actually got its start with the Free Agent Tracker. As I compiled Free Agents, I also logged their base stats and GI. But player-data-gathering wasn't the goal, so the player set was fairly small. Luckily, when I decided to build the Registry as a complete tool, the folks who run the Reddit Registry graciously agreed to let me port in stat data they had gathered over the years.
Almost half of the data in the Companion Registry comes from that first port, spanning players from 2019 and before. Another 3rd comes from logging right here on the 9 Innings Companion, either from the FA Tracker, or from my efforts to manually add cards. I've gotten big infusions from redditors amolochko and faraft. Numerous others have shared data as well.
Compiling all this data has really been a team effort. Big shout out to all those who have helped!
Stat Coverage
As of the time of this writing, the Registry is missing stats for just over 10% of players (nearly 550 players). Stat coverage isn't uniform across all the teams though. More than half of teams are missing an above average number of stats (by % of their total number of players). A lot of those missing stats are from the 2020 season. This graph shows the distribution of missing stats by team (for all available players):
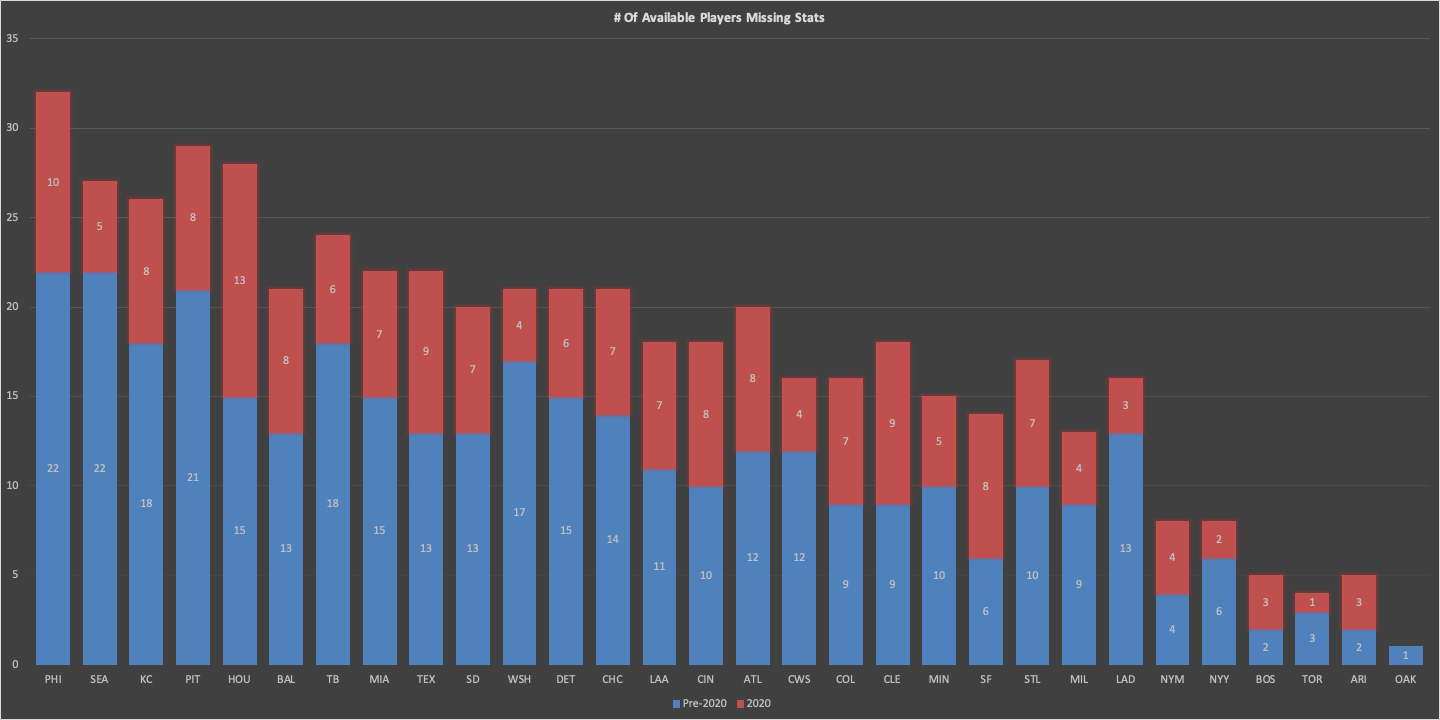
This largely matches what I expected before pulling the data. Many of the teams missing the fewest 2020 stats are teams that my OAK team plays the most in 40-game League seasons (TB, SEA, and TOR in the reg. season; CWS, NYY, WSH, LAD in the post-season). That said, I was surprised to see perennial real-life contender and reknowned percussionists, HOU, with so many missing players.
I have plans to build out a player submission form so that members of the community can submit missing stats to the registry. Keep an eye out for it!
Until then, if you'd like to submit missing stats the easiest place to reach me is on Reddit: u/9InningsCompanion.
Average Base OVR
Now into some player analysis!
One thing I was really curious to check out was the average base OVR by team, for currently-available players. Not surprisingly, LAD and HOU, two recent powerhouse franchises, hold the top two spots (with LAD head-and-shoulders above the rest):
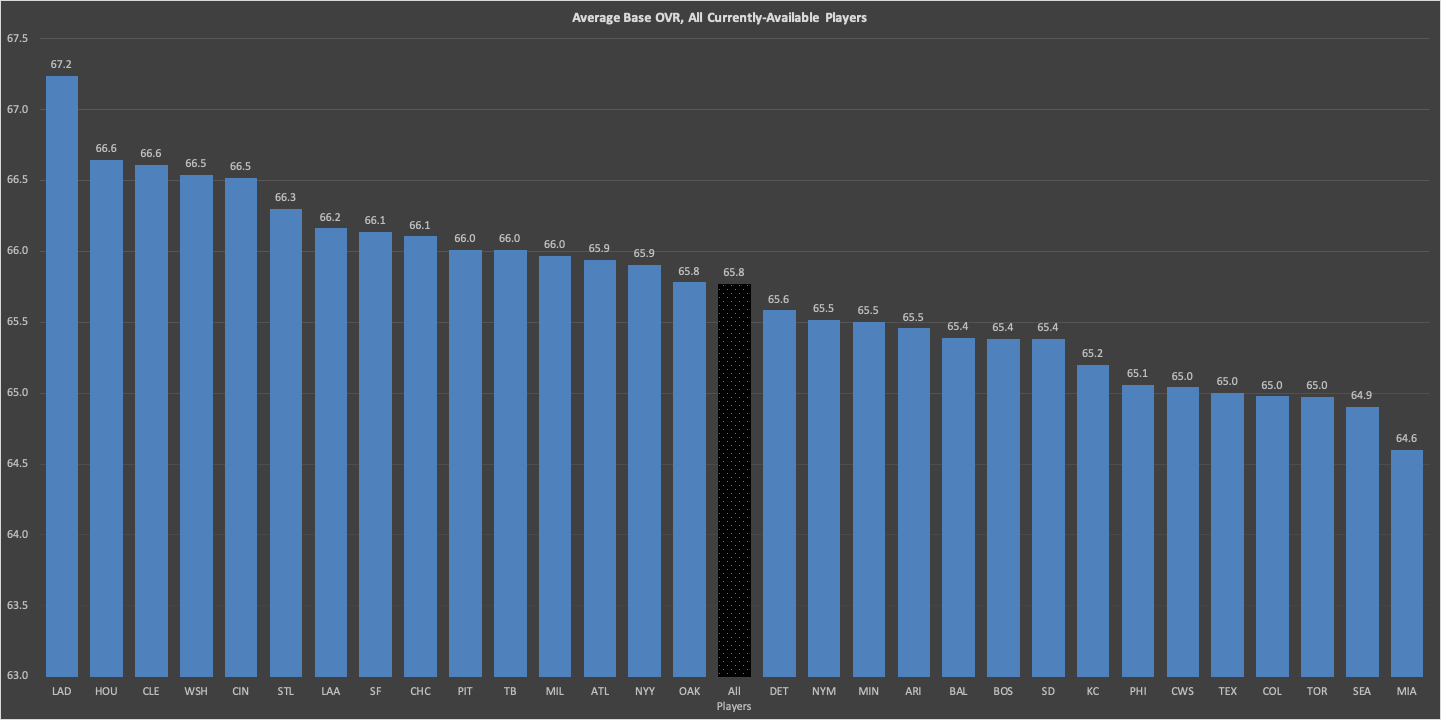
Despite the above section on missing stats, every team has over 80% stat representation, so I'm confident that this graph is largely accurate.
A couple of things that jumped out to me:
- Teams are split pretty evenly between above-average and below-average. (The all-player average is the darker column.)
- BOS is below average. That was surprising. A decent number top cards (like C.Sale, D.Price, and D.Pedroia) are out for the season, so That might be contributing to the dip. Still, they have many more low-OVR cards than I would've guessed.
-
CLE is surprisingly high. This is partially due to their wealth of
excellent SPs but they also have relatively few low-OVR cards.
- They have 16 players 73 OVR or higher, 14 of which are SPs.
- Kluber '17 is tied for 3rd-highest-OVR SP and Bieber '20 is tied for 2nd-highest.
- Lindor also has a number of >70 OVR cards, a rarity for position players.
Average aOVR Diff
And of course, I have to look into some data utilizing the Companion aOVR! In this case, I thought it'd be interesting to show the average aOVR Diff, which is simply (OVR - aOVR). aOVR Diff can indicate a discrepancy between the face value of a card (the OVR) and a more realistic value (aOVR).
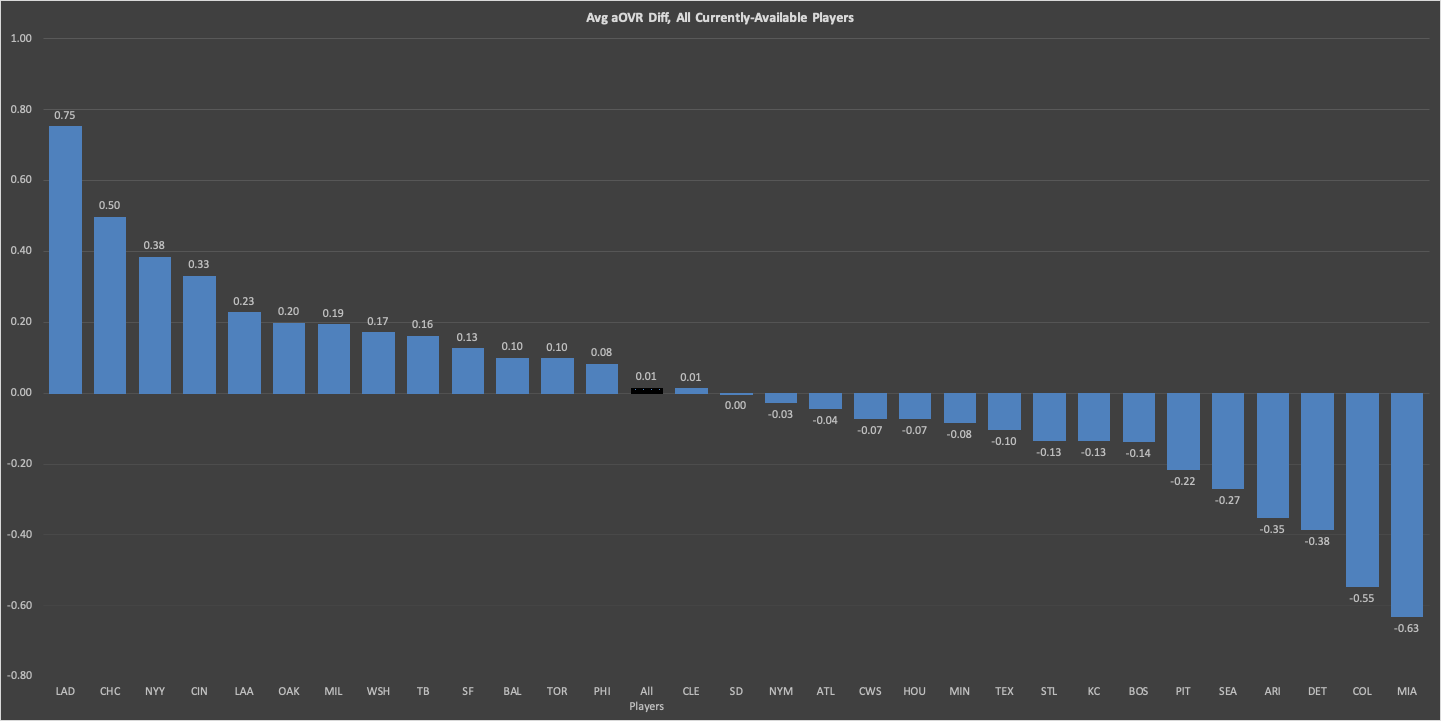
As above, this graph includes only currently-available players, and the average of all players is the darker column that sits in the middle. I found it interesting how symmetrical the graph is, even at the far ends. It almost looks like a mirror image. Unsurprisingly, LAD enjoys the privilege of the best cards. MIA gets the worst of both worlds: their cards are both low-OVR on their face and low value when considering the stats the community prefers.
A negative-aOVR Diff indicates a card is is worse off than it appears. Maybe their batters have higher SPD or FLD than hitting stats, or their SPs are heavy in the STA department. Or they could be like BOS and have a large number of weak cards muddying the waters. Case in point: look how far CLE has fallen in this list, from 3rd in avg Base OVR to 16th in aOVR Diff. This is largely because of their impressive array of stellar middle-infield defenders. Kipnis, Lindor, and A.Cabrera are all under-performers in the aOVR department due to their high FLD stats.
Remember: aOVR Diff as just an additional data point when comparing cards. A card with a negative aOVR Diff but a very high OVR will still be better than a low-OVR card with a positive Diff. What aOVR Diff does is show you an imbalance between how good the card says it is vs how good it actually is.
What's next?
That's it for this dive. Hopefully you found it informative! I enjoyed analyzing this data. So much so that I'm considering building out a dashboard with stats like these and more. I think that'd make it more accessible and easy to understand.